The first part of this post drew from amicus briefs filed with the Supreme Court to explain how truly diverse classrooms benefit students’ academic achievement, interpersonal skills, workplace preparation, and civic engagement.
The second part of the post looked at the national trend toward increasing segregation in our K-12 schools. The post explored how that trend was reinforced by misguided methods of rating schools that end up placing more value on high percentages of white students in the rated schools than on how much students are learning.
This final part of the post offers the following modest corrective to the tendency to undervalue diversity in school ratings. Along with its 100-point-scale “Report Card” score for Wisconsin school districts that it prepares each year, the Department of Public Instruction should also prepare a Diversity Index calculated on a similar 100-point scale.
Before delving into the Diversity Index, several points are worth noting. First, the negative diversity effect on school comparisons discussed in the second part of this post derives less from racism than from the unavoidable tendency to base comparisons on whatever it is that can be measured and quantified. Standardized test results provide the handiest and easiest basis for school comparisons and so it is inevitable that they will be used that way.
Second, standardized tests are not inherently bad. The basic skills they measure are critically important to school success. Year-to-year comparisons of test results can provide valuable insights for teachers and schools. So can school-to-school comparisons, so long as the schools are otherwise comparable.
Third, as noted in the second part of this post, on an aggregate basis, students of color tend to score lower than white students on standardized tests. An exploration of the reasons for this – and there are many – is well beyond the scope of this post. This aggregate effect says next to nothing about the skills and potential of individual students, but its impact must be acknowledged in order to unpack the misleading tendencies of school rating systems that are primarily based on an undifferentiated analysis of standardized test scores.
Fourth, the impressive data marshaled in the many Fisher amicus briefs leave no doubt about the non-quantifiable benefits of diverse classrooms. More encompassing and accurate methods of school evaluation and comparison should take diversity data into account. The goal should be to make smart use of that information to supplement quantitative methods of comparing schools in order to provide a more comprehensive assessment of school quality.
Fifth, we do not have ready means to measure the growth in interpersonal skills, workplace preparation and civic engagement that we know exposure to more diverse learning environments provides to students. In recognition of this gap, it makes sense to rely on diversity data itself as a proxy for the beneficial outcomes that diverse classrooms engender.
Finally – and here comes the partial remedy – it is not hard to develop a metric that represents the level of diversity in schools and school districts.
In antitrust law, the relative concentration of any particular market for products or services is measured by what’s called the Herfindahl-Hirschman Index, or HHI. The index is calculated by determining the market percentage shares of the participants in the market, squaring those percentages, and adding up the total. So, for example, if a market is entirely monopolized by one firm, its HHI would be 10,000. If the market features two firms, each with a 50% share, the HHI would be 5000. If there are six market participants with shares of 40, 20, 15, 10, 10 and 5, the HHI for the market is 2450.
A similar calculation can be applied to measure the diversity of any school district or school. DPI measures race or ethnicity in five principal categories: Asian, Black, Hispanic, White, and Two or More Races. An HHI figure can be calculated by adding up the squares of the percentages of a school districts’ students that fall into each category. (DPI also includes American Indian and Pacific Isle in its race/ethnicity categories, but the percentages are so small that they can be disregarded for these purposes.) The lower the HHI, the greater the school’s diversity.
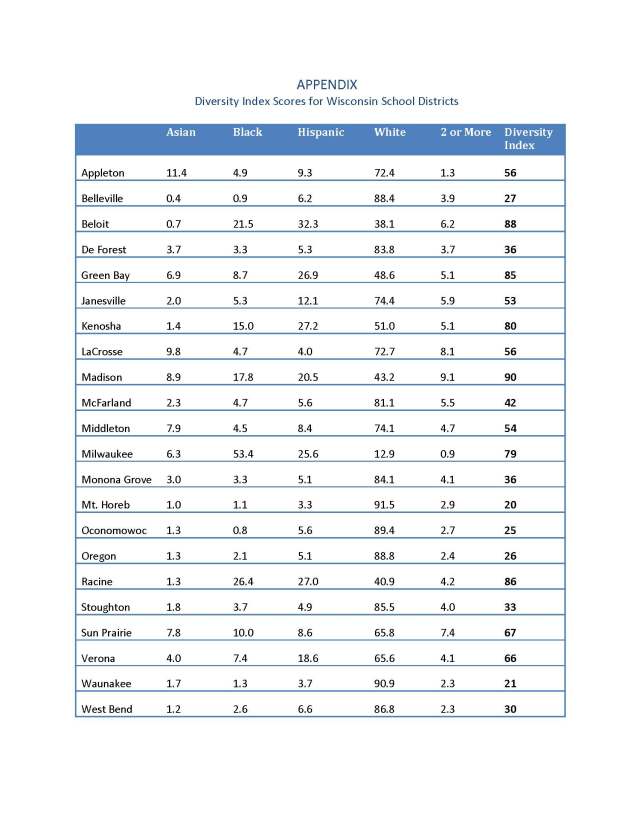
In the interest of consistency, it makes sense to convert HHI figures for school or school district diversity to the same kind of 0 to 100 score that is used in DPI’s school report cards. We can call it a Diversity Index. A Diversity Index can be calculated, first, by subtracting a school diversity HHI from 10,000 and, second, dividing the result by 100. The highest possible score under this formula is 80, since the lowest possible school diversity HHI is 2000 (the result when exactly 20% of a school’s students fall into each of the five primary DPI racial/ethnic categories). The results can be grossed up to the traditional 0-to-100 scale by multiplying by 1.25 the figure derived by subtracting the HHI number from 10,000 before dividing by 100.
Here are Diversity Index scores for large urban school districts in Wisconsin – based on DPI data for the 2015-16 school year, calculated as described above, and arranged from highest to lowest:

Here are Diversity Index scores for the principal school districts in Dane County, again from highest to lowest.

I have not calculated the Diversity Index for each school district in Wisconsin, so I cannot say for sure that Madison is the most diverse school district in the state. But it does seem likely.
Students in diverse classrooms develop skills and traits that serve them and us well, though in ways that elude measurement through standardized tests. The Diversity Index provides clear, meaningful and helpful information about the degree of diversity in Wisconsin’s school districts.
DPI should include Diversity Index scores with its school and school district report cards. Inclusion of the Index in the report cards will not remedy the report cards’ shortcomings. But it will help to put them in context in a way that will make the report cards more informative for those interested in accurate and comprehensive comparisons of school quality.
Issuing Diversity Index scores for Wisconsin school districts will also send the message that genuine classroom diversity is beneficial and undervalued, indicate that the relative degree of diversity in our schools is important enough to measure, and a represent a step toward acknowledging the broader public purpose of our public schools.