
The first part of this post drew from the many amicus briefs submitted in connection with Fisher v. University of Texas at Austin, a recent U.S. Supreme Court decision that reaffirmed colleges’ compelling interest in promoting the racial diversity of their student bodies. As the amicus briefs explain, truly diverse classrooms benefit students’ academic achievement, social and interpersonal skills, workplace preparation, and civic engagement.
This second part of the post looks at the forces pushing in the other direction. The U.S. Supreme Court’s about-face on the constitutionality of race-conscious approaches to promoting integration has removed the principal counterweight to the centrifugal forces that push white families toward predominantly white schools. Even as courts, scholars, colleges of all stripes, and Fortune 500 companies have been celebrating the many benefits of diverse classrooms, the trend in K-12 education is clearly towards more segregation. This trend is misleadingly reinforced by school rating systems that systematically undervalue the benefits students derive from truly diverse classrooms and systematically overrate predominantly white schools.
The Flow and Ebb of the Supreme Court’s Concern with Segregated Schools.
In Brown v. Board of Education, the U.S. Supreme Court emphasized that “education is perhaps the most important function of state and local governments,” as it famously rejected the doctrine of Plessy v. Ferguson and ruled that “separate educational facilities are inherently unequal.” In a follow-up decision, the court ordered states to desegregate their schools “with all deliberate speed.”
Subsequent desegregation efforts focused more on “deliberate” than “speed.” It was not until the Civil Rights Act in 1964 authorized Department of Justice lawyers to sue segregated school districts that appreciable progress began to be made. The Supreme Court’s high water mark in promoting desegregation came in a 1970 decision, Swann v. Charlotte-Mecklenburg Board of Education, where it unanimously upheld busing as a permissible means to promote school integration.
With the election of Richard Nixon in 1968, the pendulum started its rightward swing. By the end of 1971, Nixon had appointed four Supreme Court justices. In 1974, the votes of those justices helped overturn a lower court order mandating a desegregation program encompassing inner city Detroit schools and surrounding predominantly white suburbs. Since then, the Supreme Court has been more of an obstacle than an asset in school desegregation efforts.
The nadir was reached in 2007, when in a pair of cases known as Concerned Citizens the Court struck down the voluntary efforts of school districts in Seattle and Louisville to use race-conscious strategies to maintain the racial composition of district schools at roughly the same percentages as the districts as a whole. In his dissent, Justice Breyer condemned the majority’s stripping away of the authority of local School Boards to employ race-conscious strategies to address school segregation. He wrote: “I fear the consequences of doing so for the law, for the schools, for the democratic process, and for America’s efforts to create, out of its diversity, one Nation.”
The federal retreat from desegregation efforts was also evident in the approach of the No Child Left Behind law. It reflected a fundamentally different approach to improving the education of students of color, akin to the “separate but equal” doctrine that the Brown court rejected. The goal of NCLB was to test students to measure their learning, wherever they went to school. The focus shifted from the racial composition percentages of schools to the proficiency percentages of students on standardized tests.
The Trend Toward Racially Homogeneous Schools.
The consequences of the federal government’s retreat from the promise of Brown v. Board of Education have been predictable. Without the prod of deliberate desegregation efforts, the racial make-up of public schools has drifted toward homogeneity.
The dissent in Concerned Citizens describes how the rising tide of school integration sparked by Brown v. Board of Education has since receded:
Between 1968 and 1980, the number of black children attending a school where minority children constituted more than half of the school fell from 77% to 63% in the Nation (from 81% to 57% in the South) but then reversed direction by the year 2000, rising from 63% to 72% in the Nation (from 57% to 69% in the South). Similarly, between 1968 and 1980, the number of black children attending schools that were more than 90% minority fell from 64% to 33% in the Nation (from 78% to 23% in the South), but that too reversed direction, rising by the year 2000 from 33% to 37% in the Nation (from 23% to 31% in the South). As of 2002, almost 2.4 million students, or over 5% of all public school enrollment, attended schools with a white population of less than 1%. Of these, 2.3 million were black and Latino students, and only 72,000 were white. Today, more than one in six black children attend a school that is 99–100% minority.
The Fisher amicus brief submitted by the Leadership Conference on Civil and Human Rights brings the figures evidencing the growing school segregation trend up to date:
Nationally, the average white student attends a school that is almost 72.5% white, 11.8% Latino, 8.3% black, 3.9% Asian, and 3.5% Native American or multiracial. . . The average black student attends a school that is 48.8% black, 27.6% white, 3.6% Asian, 17.1% Latino, and 2.9% Native American or multiracial. . . Latino students often attend schools that are 56.8% Latino, 25.1% white, 10.9% black, 4.7% Asian, and 2.5% Native American or multiracial. . . The average Asian student attends a school that is 38.9% white, 24.5% Asian, 22.1% Latino, 10.7% black, and 3.8% Native American or multiracial.
Nikole Hannah-Jones, today’s preeminent chronicler of our segregated schools, sums it up:
Legally and culturally, we’ve come to accept segregation once again. Today, across the country, black children are more segregated than they have been at any point in nearly half a century. Except for a few remaining court-ordered desegregation programs, intentional integration almost never occurs unless it’s in the interests of white students.
Closer to Home.
In light of the Race to Equity Report, it comes as no surprise that the Madison area does not provide an exception to the national trend. Because Dane County is predominantly white, there is little chance of any of our schools being dominated by students of any other race. Only white families have the privilege of choosing to enroll their children either in schools with an overwhelming percentage of students of their own race, or in more diverse schools.
Any family’s selection of a school can take into account a host of factors. Nevertheless, it is certainly true that not all white parents in Dane County choose to maximize their children’s experience with diverse classrooms. The percentage of white students in Madison’s schools has slowly but steadily been decreasing over the years. White families are substantially overrepresented among those who choose to open enroll their children out of their home Madison schools and into the schools of neighboring school districts. Local realtors tend not to highlight the benefits of increased diversity to white families looking to relocate to the area.
White Parents Want to Set Up Their Kids for Success, Most Often with Lots of Other White Kids.
What accounts for the trend toward racially homogeneous schools? Factors are at work that are more nuanced than explicit racism, or, as Slate put it “many white parents, long accustomed to various forms of privilege and preference, fear[ing] their children being in the minority.”
According to an article in the Atlantic:
Some of the most striking studies done on present-day segregation have to do with how it’s connected to the ways families share money and other resources among themselves. The sociologist Thomas Shapiro, for instance, argues that the greater wealth that white parents are likely to have allows them to help out their children with down payments, college tuition, and other significant expenses that would otherwise create debt. As a result, white families often use these “transformative assets” to purchase homes in predominantly white neighborhoods, based on the belief that sending their children to mostly white schools in these areas will offer them a competitive advantage. (These schools are usually evaluated in racial and economic terms, not by class size, teacher quality, or other measures shown to have an impact on student success.) Shapiro’s research shows that while whites no longer explicitly say that they will not live around blacks, existing wealth disparities enable them to make well-meaning decisions that, unfortunately, still serve to reproduce racial segregation in residential and educational settings.
Additionally, white parents in Dane County, like all parents regardless of ideological leaning, want their children to attend schools that will prepare them to be successful. Parents look for highly-rated schools for their kids, particularly when they are moving to a new area and have a choice of where to live. Unfortunately, the scores of the best-known rating organization are unreliable as signifiers of school quality.
The Problem with School Ratings.
The ways we typically rate schools undervalue the benefits of diversity and overrate schools with a high percentage of white students.
There are a couple of key reasons for this. First, it is not easy to measure and quantify the understandings and skills that immersion in diverse schools engender in our students. We can say diversity provides benefits all we want, but – short of citing Fisher amicus briefs – we haven’t had much that’s concrete to back up our claim. This makes it a challenge to persuade those in Dane County who are not already convinced that diversity in our classrooms is a good thing for all students.
Second, quantification and measurement is exactly what standardized tests do. On an aggregate basis, and for a host of reasons, students of color score lower than white students on standardized tests. When schools are ranked strictly on the basis of standardized test results – as they often are – diversity flips from an asset to a burden.
Here is an example based on data from the 2014-15 school year. Suppose you wanted to compare the academic performance of the students at two of the top-notch high schools in the area, Madison West and Middleton, for that year. The information to do so is available on the DPI website. You can learn how the students at each school did by looking at the ACT Statewide data. You would see that the average ACT score for Madison West students was 23.2, compared to 23.6 for Middleton students. So Middleton students did better, right?
Well, not so fast. Let’s dig a little deeper. Let’s look at 2014-15 average ACT scores by racial/ethnic group, also as reported by DPI:
 Madison West students did better in every category where there is a basis for comparison. (The number of Madison West students of two or more races who took the test was below the threshold for DPI to calculate an average score.) So why does Middleton have the higher overall average? This outcome is completely determined by the demographics of the schools. There are more West students than Middleton students in the lower-scoring categories, and this effect overwhelmed West’s clear superiority in the category-by-category comparisons.
There is more evidence of diversity’s negative impact on school comparisons all around us. For example, Google “best schools in Dane County.” You’ll get greatschools.org, or perhaps Zillow, which incorporates GreatSchools ratings. GreatSchools assigns a rating on a 1-to-10 scale to every school around. From all that appears, the GreatSchools ratings are the most commonly referred to sources of information about the relative quality of schools available to newcomers to our area or those contemplating relocation.
The GreatSchools rankings of Dane County schools appears to be entirely based on the results of standardized tests, undifferentiated by school demographics, income levels, or anything else. Not surprisingly, there is a substantial diversity deduction in these rankings. To understand why, we need to focus on how the ratings reflect the achievement levels and preponderance of white students at our schools.
Looking at the standardized test scores of white students provides an evenhanded basis for comparison, unaffected by the schools’ differing demographics. In addition, it is the white families in the Madison area who are in the best position to affect the level of diversity in our schools, primarily through their choices of whether to enroll their students in Madison public schools or suburban or private alternatives. In light of this, it makes sense to tailor the analysis to the considerations that would be most relevant for them, in part so that we can have some basis to assess the validity of a “school quality” explanation for choosing a non-MMSD school.
The following tables shows three data points for the high schools in the Madison area: 2015-16 average composite scores for white students taking the ACT Statewide exam administered to all students in grade 11; percentage of the student body comprised of white students; and GreatSchools ranking on its 1-to-10 scale.
| High School | Average ACT Score for White Students | Student Body % White | GreatSchools Rating |
| DeForest | 21.1 | 84.1 | 9 |
| East | 23.8 | 38.5 | 3 |
| LaFollette | 21.5 | 40.6 | 2 |
| McFarland | 23.4 | 84.9 | 10 |
| Memorial | 24.6 | 51.1 | 6 |
| Middleton | 24.4 | 77.9 | 7 |
| Monona Grove | 23.0 | 85.1 | 8 |
| Mt. Horeb | 22.3 | 91.5 | 9 |
| Oregon | 22.5 | 89.1 | 7 |
| Stoughton | 21.5 | 88.2 | 9 |
| Sun Prairie | 22.6 | 69.0 | 9 |
| Verona | 23.1 | 67.7 | 8 |
| Waunakee | 23.3 | 91.9 | 9 |
| West | 25.4 | 53.3 | 7 |
It turns out that the GreatSchools ratings bear no relationship at all to the average composite ACT scores earned by white students at the different high schools, which presumably would be data of interest to white families seeking to relocate to Madison.
Here is a table that plots average composite ACT scores for white students on the X axis and GreatSchools rating on the Y axis for each of the high schools.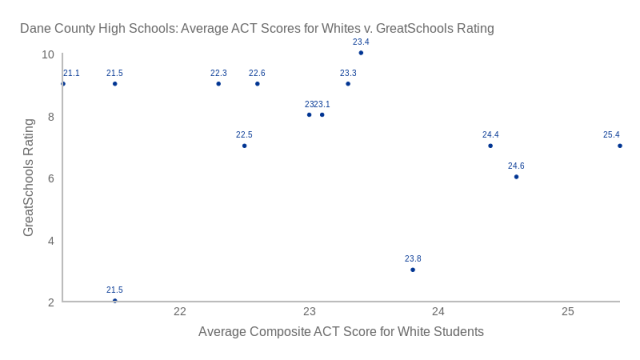
There is a very weak correlation of -0.1208, which is far from statistically significant. Inconveniently for GreatSchools, the correlation, such as it is, is negative – the higher the average ACT score, the lower the GreatSchools rating. This upside-down result is driven by the low ratings assigned to Madison’s four high schools (no non-MMSD high school is rated lower than any MMSD high school). This despite the fact that three of the four schools with the top ACT scores are West, Memorial and East. East, the most diverse high school in the area, is a particular outlier on this table.
It is certainly instructive that we obtain a far more robust correlation when we plot the percentage of the high school’s student body comprised of white students against the GreatSchools rating:

Here we get a statistically-significant positive correlation of 0.8356 – which means that high GreatSchools ratings are strongly correlated with high percentages of the student body comprised of white students.
In other words, in doling out its top ratings, GreatSchools doesn’t particularly care how well white students perform, as long as there are lots of them at the school.
This is not a statistical aberration confined to high schools. For elementary schools in the Madison school district, there is also a strong positive correlation of 0.7559 between the GreatSchools ratings and the percentage of the school’s student body that is white.
So, in the most widely available rating system for schools, Madison’s public schools are effectively penalized for their diversity. This doesn’t make sense, it certainly undermines whatever confidence one might have in the GreatSchools ratings, and it hurts our schools.
It is the same with the state’s school report cards. Pursuant to a legislative mandate, DPI prepares report cards for each Wisconsin school and school district that include an overall score on a 0 to 100 scale. As I have written, while the report card methodology includes measures that attempt to take student demographics into account, overall student performance on standardized tests remains the driving force behind the scores for each school and school district.
The DPI report cards do better dealing with diversity than the GreatSchools ratings, but the methodology still falls short. There is a moderate (0.622) but statistically-significant correlation between DPI report card scores for school districts in Dane County and the percentage of white students in those districts.
Summing Up.
Truly diverse classrooms provide substantial but non-quantifiable benefits for all students. Recognizing the benefits, colleges and universities seek out and celebrate diverse student bodies.
But we have essentially given up on promoting diversity and integration as deliberate educational policies at the K-12 level. Instead, we defer to individual parent choice as matter of policy, which for these purposes means the choices of white parents.
While in the words of Nikole Hannah-Jones, diversity finds support as “a boutique offering for the children of the privileged,” most white parents implicitly or explicitly view a predominantly white student body as a key component of school quality.
This understanding is misleadingly reinforced by school rating systems that systematically undervalue the benefits students derive from diverse classrooms and systematically inflate the ratings of schools that are already dominated by white students.
The third part of this post will offer a suggestion for providing a modest counterweight to these rating systems that recognizes diverse classrooms as a benefit and quantifies the degree of diversity in our schools.

Thanks Ed. Great article. I’m also interested in your thoughts about promoting diversity/integration within our own district.